climate-shift You are hereClimate exposure of the land around any point you click, in Brazil and Canada: today's land use read against CMIP6 projections of heat, drought and heavy rain — plus measured fire, terrain, rain and wind.
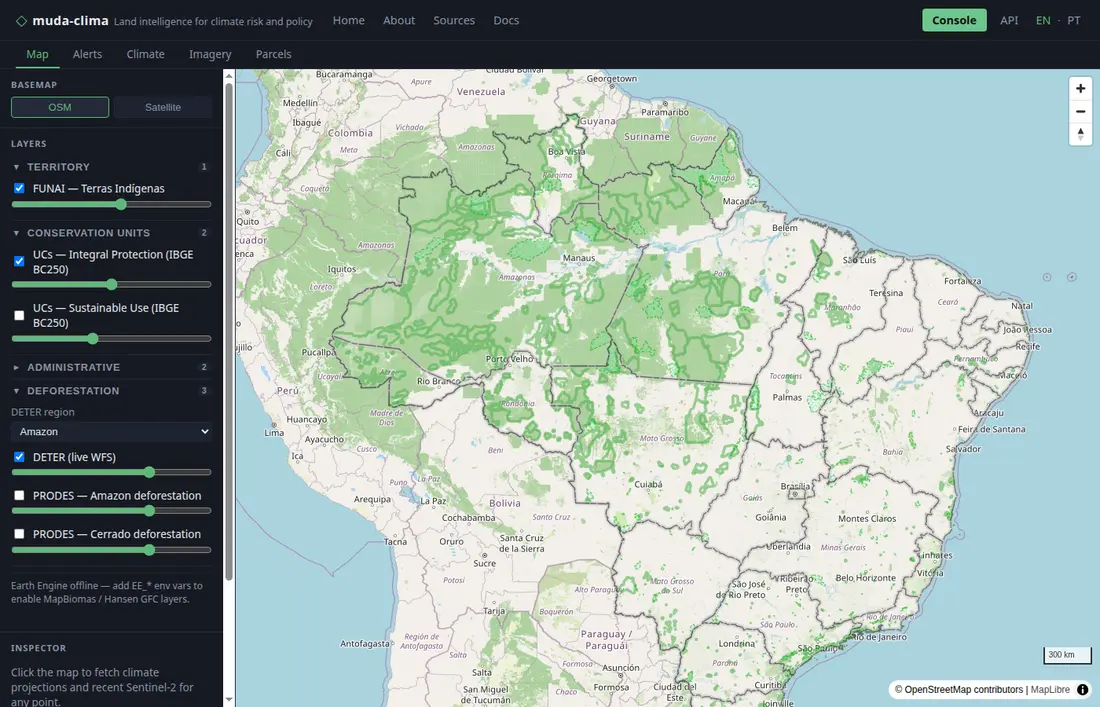
Click any point in Brazil or Canada. climate-shift reads the land use around it (MapBiomas, AAFC) and crosses it with nine CMIP6 climate models to tell which area is exposed to more heat, drought and heavy rain in 2041–2070 — openly, with the models' coarse scale drawn on the map. Deforestation alerts, ENSO and Sentinel-2 imagery sit alongside, and the same data flows through an open API.
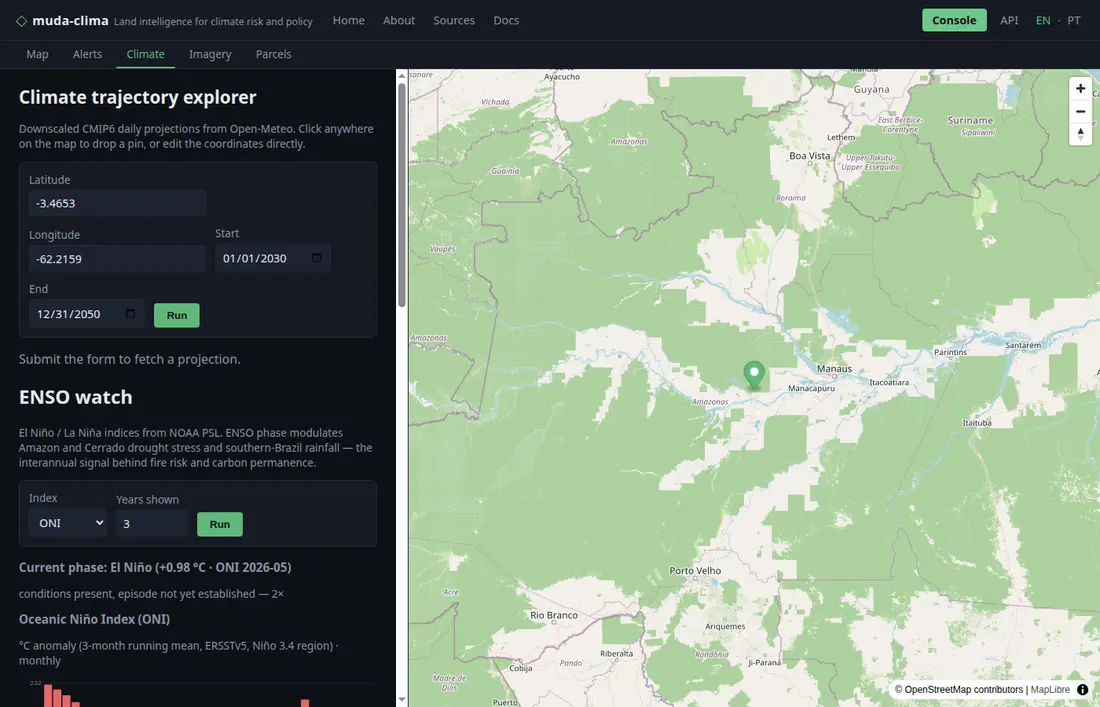
The current El Niño / La Niña phase classified from the latest ONI value, nine NOAA indices charted, and projected temperature and rainfall for any pinned coordinate.
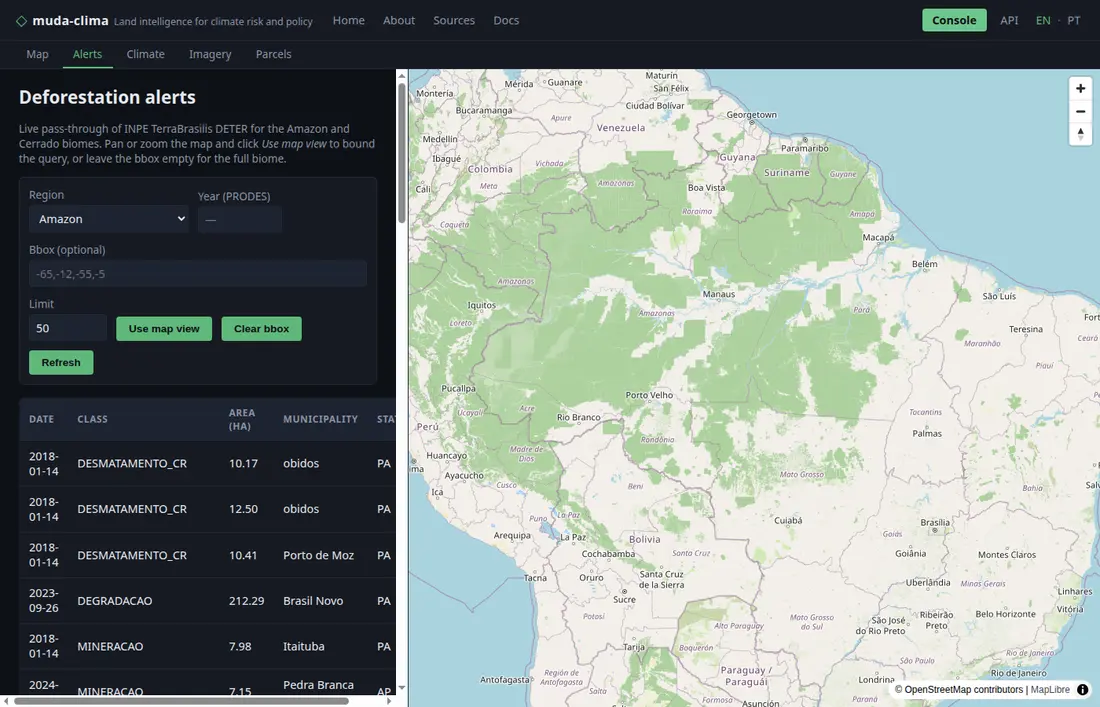
Near-real-time DETER alerts next to consolidated PRODES yearly polygons for all six biomes — filter by region, year, and map view, with every row drawn on the map.
Pick a radius and an emissions scenario, then click. The circle's land use (MapBiomas, latest year) meets the climate models' signal for its cell, and the story names the probable exposed area for each hazard the models agree on.
Pixels and grid cells are raw material. Every output is keyed to a stable parcel UUID linked to all external cadastral IDs (CAR, SIGEF, FUNAI, LTSA, ISC) — the audit trail carbon registries and regulators need.
Indigenous data held in trust
Three hard data tiers governed by FPIC in Brazil and OCAP in Canada. Communities are partners with revenue share, not subjects of monitoring. Right-to-withdraw is a first-class technical guarantee.
Provenance hashed end-to-end
Every record carries a SHA-256 hash over its source dataset versions. Carbon buyers and reinsurers can reproduce a risk score months later and prove which Sentinel scene, CAR version, and CMIP6 run produced it.